
What is intermittent demand?
Intermittent demand, also called sporadic demand, describes a demand pattern in which demand does not occur continuously, but at irregular intervals. Between order points there are long periods without any demand, so-called zero phases.
The opposite is smooth or steady demand: a part that is ordered in similar quantities every month and is therefore easy to forecast.
In the academic literature, intermittent demand is distinguished from related patterns:
For the practice of spare parts planning in mechanical engineering, intermittent and lumpy demand are particularly relevant, they account for over 80% of typical spare parts assortments.
Why does intermittent demand arise for spare parts?
Unlike in the consumer goods sector or in series production, demand for spare parts does not follow the purchasing behavior of end customers, it follows the condition of machines.
This leads to structurally irregular demand for several reasons:
Why do classic forecasting methods fail with intermittent demand?
Most forecasting methods implemented in ERP systems — Moving Average, Exponential Smoothing, linear regression — were developed for continuous demand patterns. They assume that demand is similar from period to period and that fluctuations scatter around a mean.
With intermittent demand, these assumptions do not hold. The consequences are predictable:
Which methods work for intermittent demand?
Research into intermittent demand has produced specialized methods over the past decades that can handle the particularities of sporadic demand patterns.
The key insight: no single method is optimal for all parts and all situations. Good spare parts planning therefore uses a model selection process, multiple methods are tested in parallel, and for each SKU, the model with the lowest error rate is selected.
-
Croston method
The Croston method is the best-known specialized method for intermittent demand. It models order points and order quantities separately, rather than calculating the average across all periods including zero phases. The result is a more stable forecast that correctly interprets zero phases.
Image Source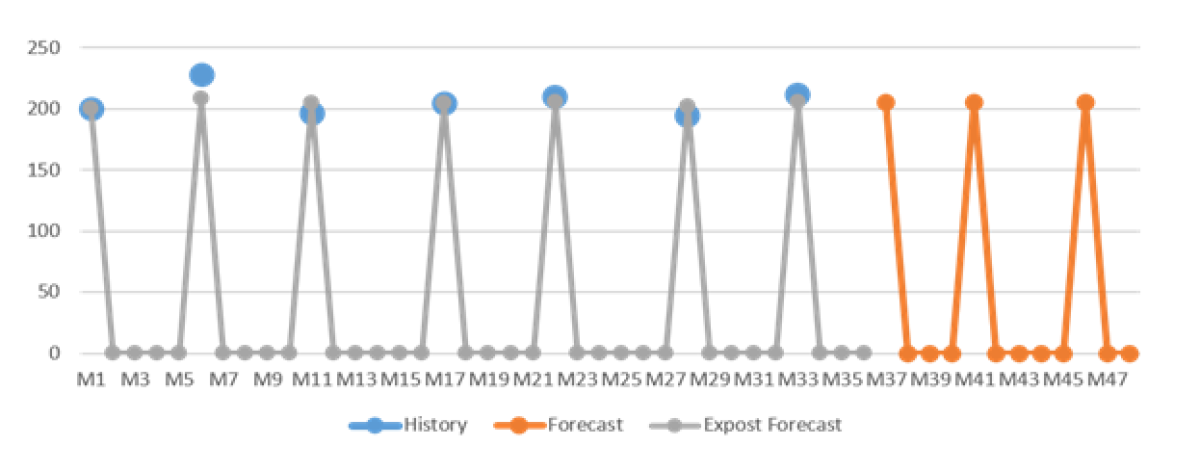
-
Syntetos-Boylan Approximation (SBA)
The Syntetos-Boylan Approximation (SBA) is a further development of the Croston method that corrects known biases of the original method and consistently delivers better results in academic comparisons.
Image Source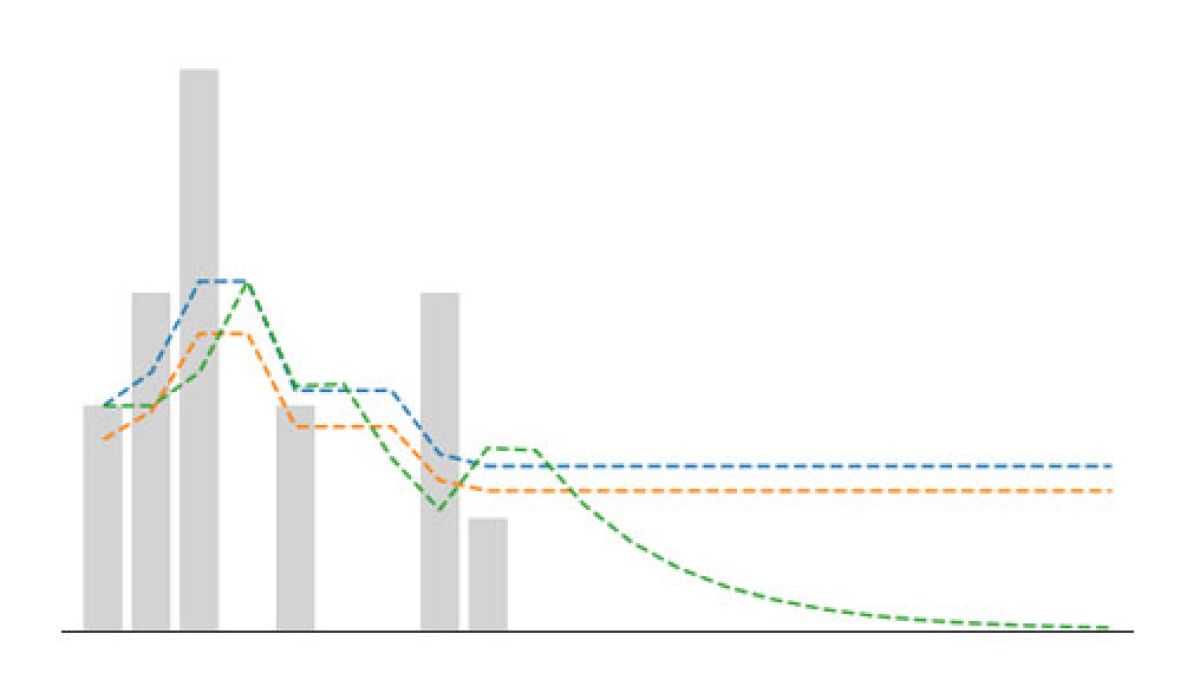
-
ADIDA
ADIDA (Aggregate-Disaggregate Intermittent Demand Approach) aggregates demand across multiple periods before the forecast is created, then disaggregates the result afterwards. This reduces the number of zero periods and improves forecast accuracy.
Image Source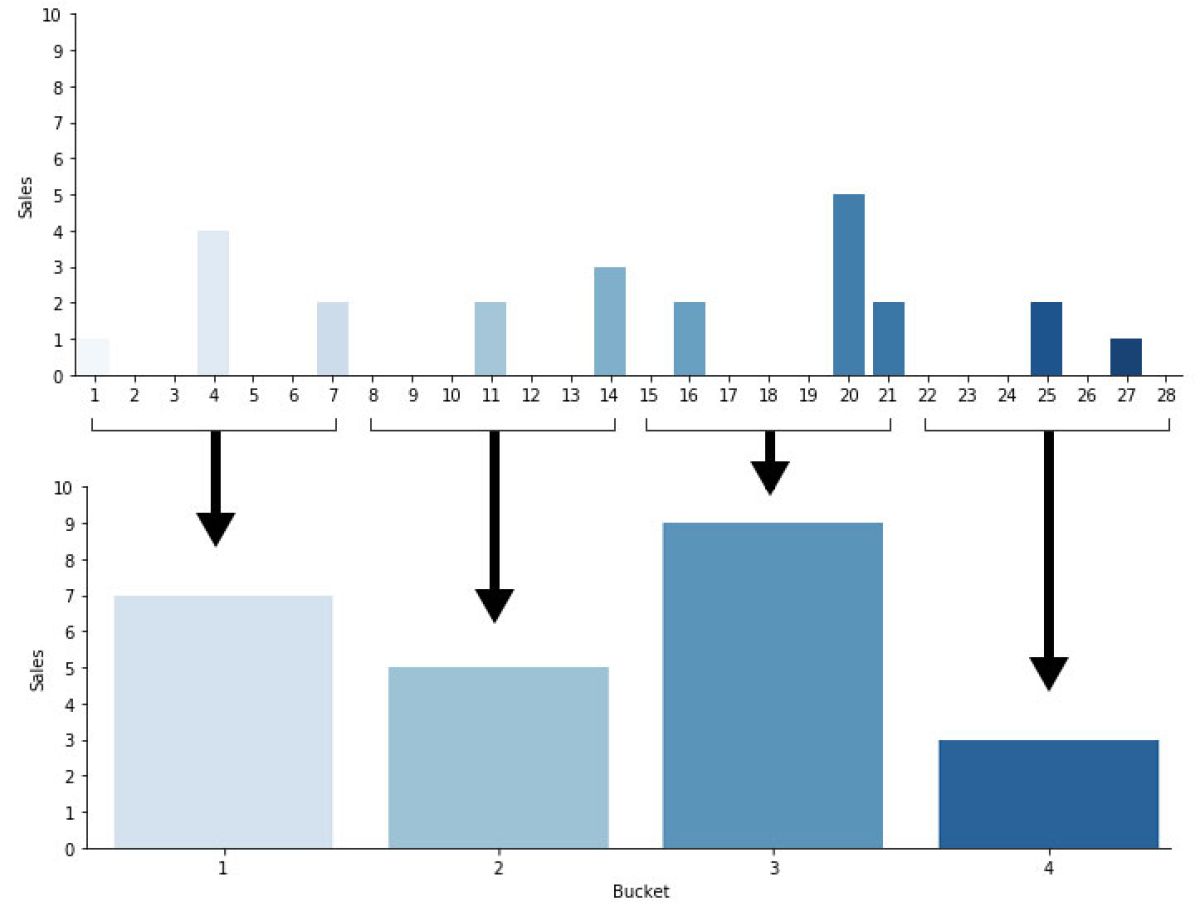
-
Gradient Boosting Methods
ML-Modelle für intermittierende Nachfrage wie LightGBM oder andere Gradient-Boosting-Methoden können bei ausreichender Datenbasis bessere Ergebnisse liefern als klassische statistische Methoden, besonders wenn zusätzliche Informationen wie Installationsbasis, Wartungszyklen oder Kundendaten verfügbar sind.
Image Source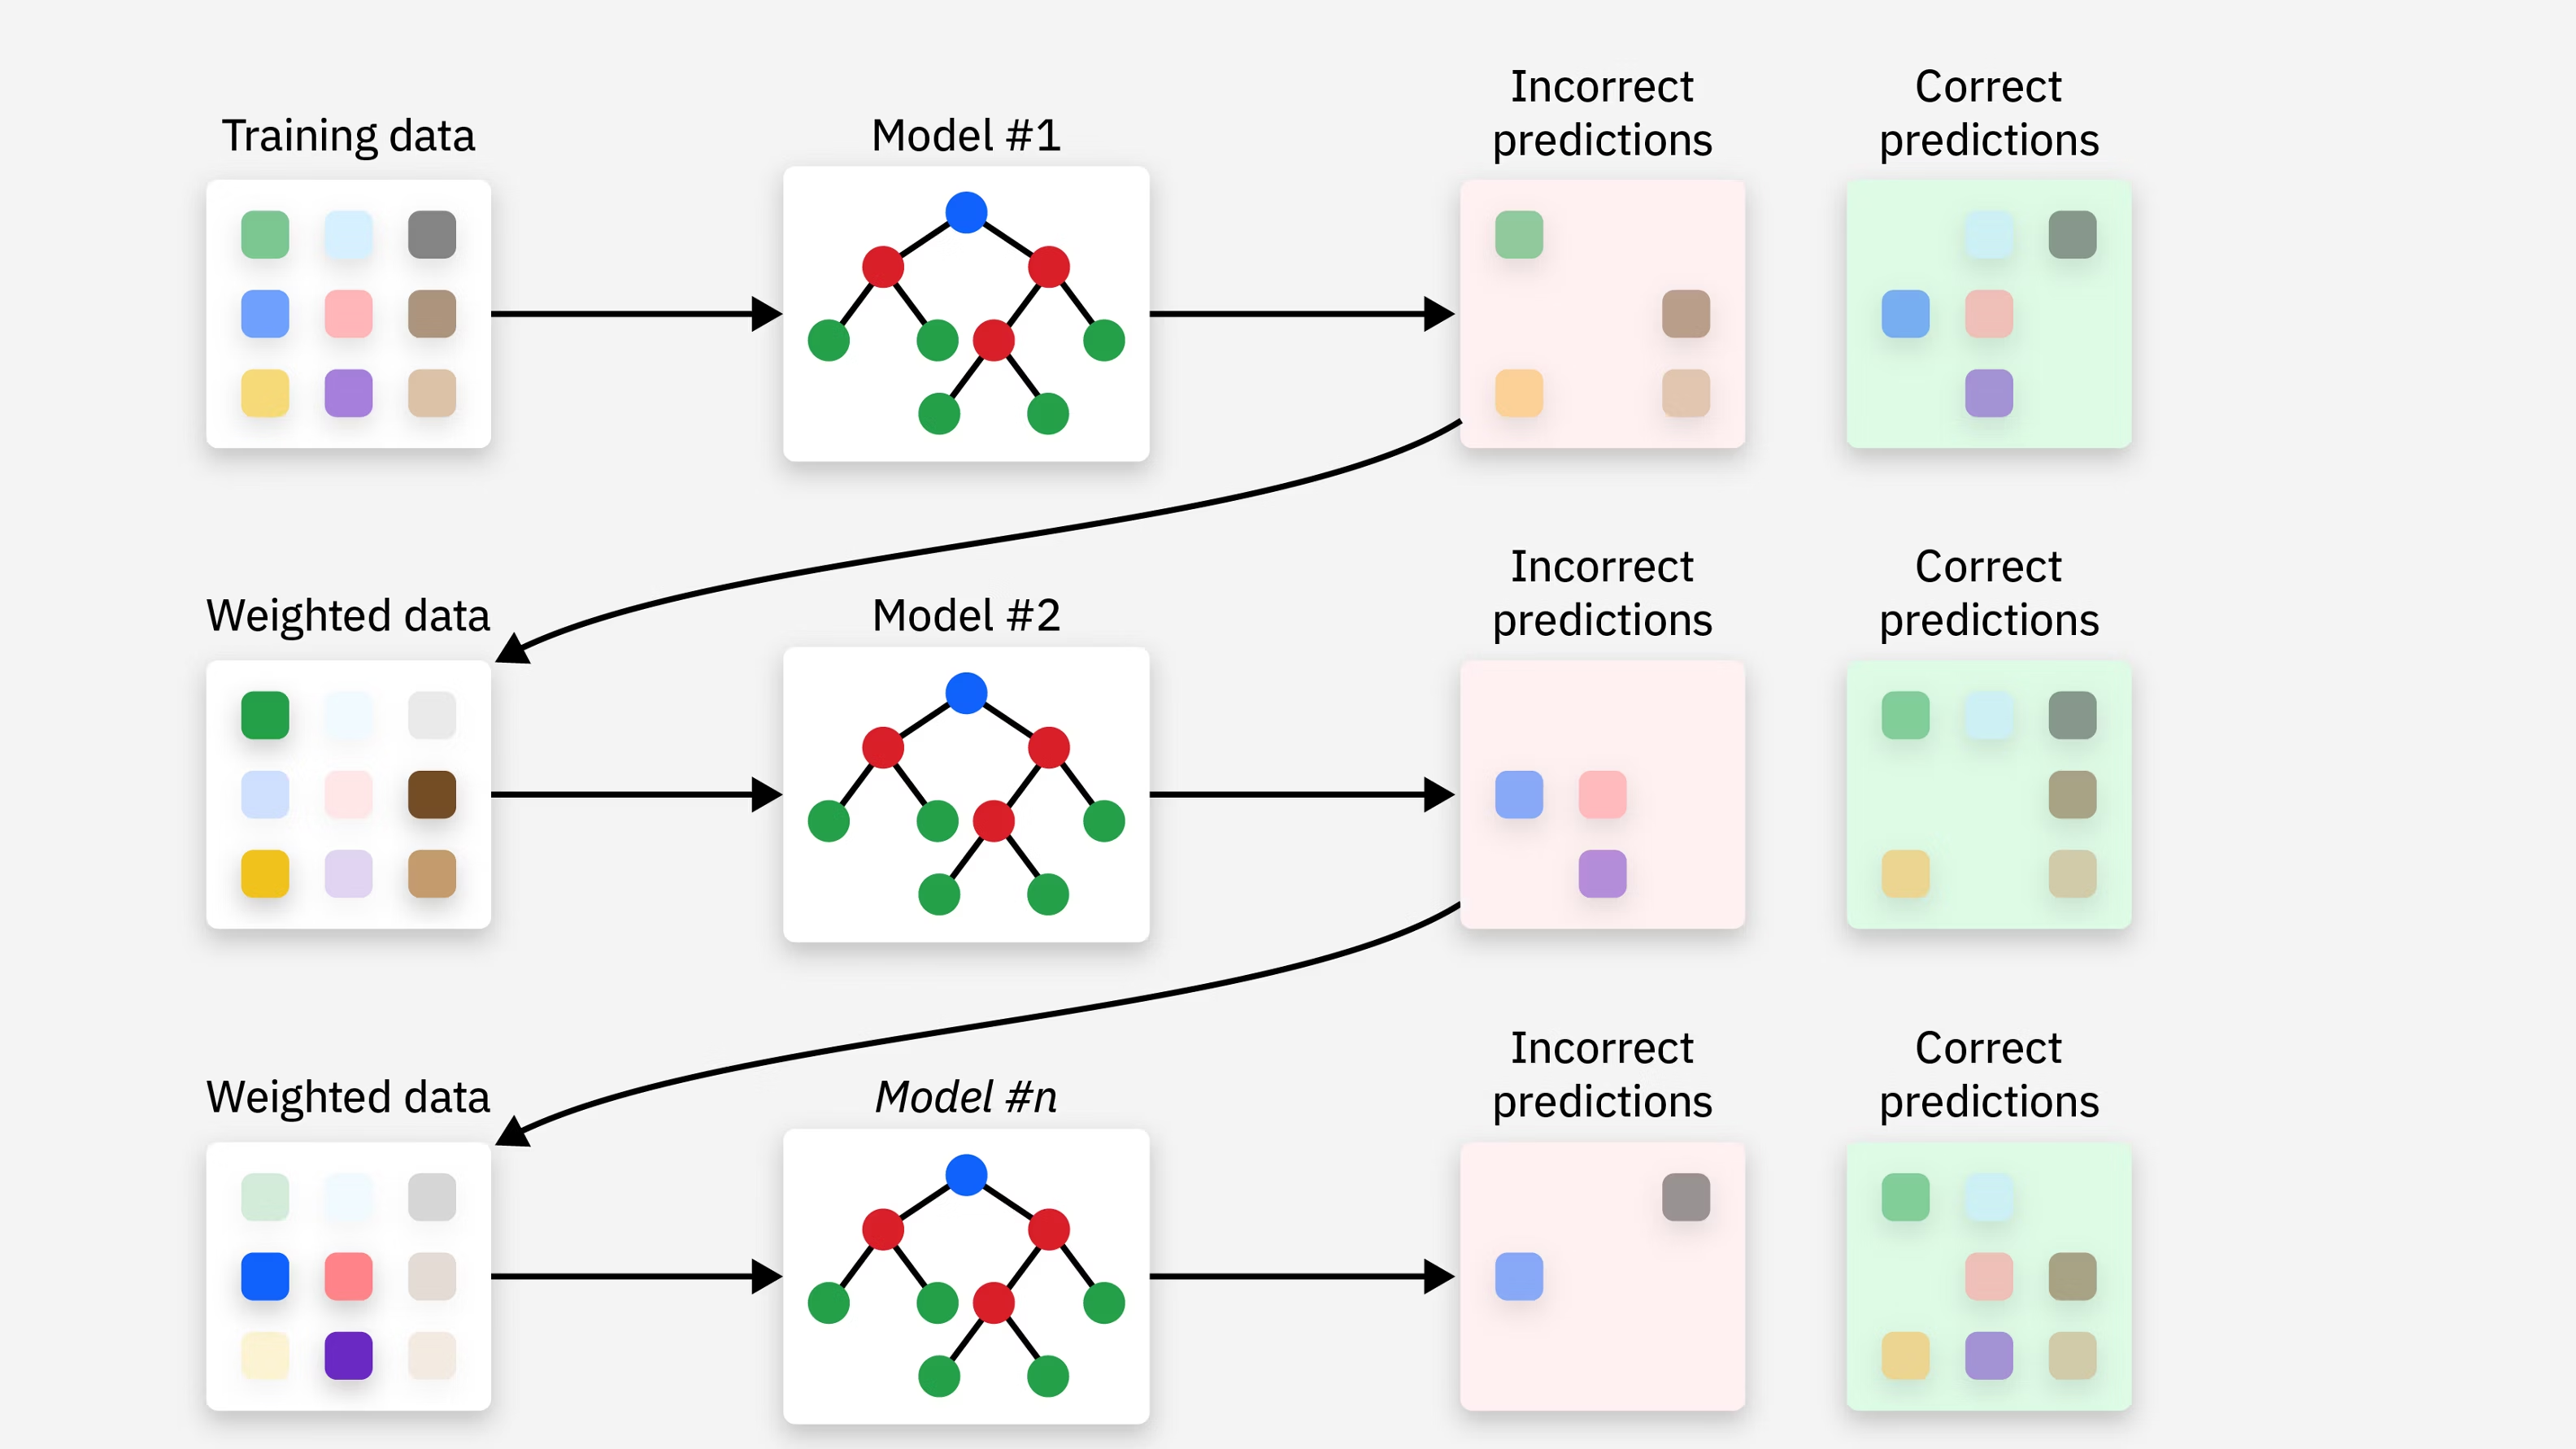


Probabilistic planning instead of point forecasts
Beyond choosing the right forecasting method, there is a more fundamental paradigm shift that is particularly relevant for intermittent demand: the move from point forecasts to probabilistic forecasts.
A point forecast says: "Next month, 3 units will be needed."
A probabilistic forecast says: "With 70% probability, 0–2 units will be needed; with 20% probability, 3–5 units; with 10% probability, more than 5 units."
For inventory planning, the probabilistic approach is superior because it reflects the inherent uncertainty of intermittent demand instead of hiding it. The planner can then make a conscious decision: for which service level am I willing to accept which risk? This decision can be made individually for each part; critical parts receive a higher service level and, therefore, a higher safety stock, and non-critical parts receive a lower one.
Intermittent demand and practice in mechanical engineering
What does this mean in concrete terms for after-sales teams in German mechanical engineering?
First, some context: most teams we know have no systematic distinction between intermittent and other demand patterns. All parts are planned using the same standard ERP functions, regardless of whether it is a fast mover or a part that is ordered three times a year.
This is not negligence; it is the result of tools that were built for a different purpose and planning capacities that are insufficient for manual differentiation.
The first step toward better planning of intermittent demand is therefore almost always the same: classification.
Which parts in the assortment have which demand pattern? Where are the critical slow movers that are not being actively planned today? Where do most stockouts occur, and are these parts intermittent or lumpy?
These questions can be answered with the data available in any ERP system. What is often missing is the systematic analysis.
Conclusion
Intermittent demand is the defining planning problem in the spare parts business. Over 80% of SKUs in a typical mechanical engineering assortment do not follow a smooth demand pattern, and yet they are planned using methods that were developed for smooth demand.
The solution is no more complicated than the problem. Specialized methods such as the Croston method, probabilistic planning, and automatic model selection are accessible today, without years-long implementation projects and without replacing existing ERP systems.
The planner who works with these methods today makes better decisions, with less effort, fewer stockouts, and less tied-up capital.
Frequently asked questions about intermittent demand
-
What is the difference between intermittent and sporadic demand?
The terms are often used interchangeably. In the academic literature, intermittent demand refers specifically to the pattern with irregular order points but similar order quantities. Sporadic demand is the overarching term for all irregular demand patterns, including lumpy demand.
-
How do I recognize intermittent demand in my data?
A simple metric is the ADI (Average Demand Interval), i.e., the average number of periods between two orders. An ADI greater than 1.32 is considered in the literature as an indicator of intermittent demand. Combined with the squared coefficient of variation CV² of order quantities, a complete classification into smooth, erratic, intermittent, and lumpy can be performed.
-
Can SAP plan intermittent demand?
SAP offers planning functions for sporadic demand, for example, the Croston method in SAP IBP. However, these functions are often not optimized for spare parts planning-specific requirements and require manual parameterization. In practice, the available methods are rarely fully utilized because the setup is complex and ties up planning capacity.
-
What is the difference between intermittent demand and zero demand?
Zero demand means that a part is permanently no longer needed, for example, because the associated machine has been decommissioned. Intermittent demand means that a part is still needed, but rarely and irregularly. The distinction is relevant for planning: parts with genuine zero demand should be classified as obsolete and written off from active inventory.
Sources:
- Croston, J.D. (1972): Forecasting and Stock Control for Intermittent Demands
- Syntetos, A.A. & Boylan, J.E. (2005): The Accuracy of Intermittent Demand Estimates
- ABB Motion Services, Value of Reliability Study, 2023