
What is a reorder point?
The reorder point is a threshold in the warehouse. When available stock for a part falls to this level, a replenishment order is triggered. In an ERP this usually happens automatically as a purchase proposal or purchase requisition. The underlying method is called reorder point planning.
The reorder point is sized so that the remaining stock covers the time until the new delivery is available. Ideally the safety stock stays untouched; it only absorbs deviations such as unexpectedly high usage or a late delivery.
Reorder point in SAP: The reorder point is a field in the material master (MRP 1 view). With MRP type VB (manual reorder point planning) you maintain it yourself. With VM (automatic reorder point planning) SAP calculates reorder point and safety stock from the forecast.
The reorder point formula
Reorder point = (average daily usage × replenishment lead time in days) + safety stock
- Average daily usage: usage per working day, usually annual usage divided by the number of working days.
- Replenishment lead time: the time from reaching the reorder point until the part is available in stock. This includes internal order processing, the supplier's delivery time, and goods receipt and inspection. Using only the supplier's delivery time underestimates it.
- Safety stock: the buffer for deviations. How to calculate it depends heavily on the demand pattern.-
Worked example: reorder point for a wear part
A seal kit for a hydraulic cylinder is used evenly throughout the year:
- Annual usage: 1,000 units over 250 working days, i.e. 4 units per day
- Replenishment lead time: 15 working days
- Safety stock: 20 units
- Purchase price: €18 per unit
Reorder point = 4 × 15 + 20 = 80 units.
When stock drops to 80, an order is placed. Around 60 units are used during the 15 days until delivery. If the delivery is on time, 20 units remain. In euros: at the reorder point, €1,440 worth of stock is on the shelf, of which €360 is permanently tied up in safety stock.
The formula works for this part because the seal kit is needed every day in similar quantities.
When the formula is reliable
The reorder point formula rests on four silent assumptions.
These assumptions typically hold for consumables, standard parts and fast-moving wear parts. In the spare parts business, that is often only part of the range.
Why the reorder point formula fails for spare parts
- With sporadic demand, there is no "daily usage"
Take a hydraulic valve for a machine that has been running in the field for years:
- Purchase price: €1,250
- Annual demand: 12 units, spread over just three orders: February 5, July 4, November 3. No demand in the other nine months.
- Replenishment lead time: 60 working days
On paper, daily usage is 12 ÷ 250 = 0.048 units. Multiplied by a 60-day lead time, that is 2.9 units, so the reorder point without safety stock is about 3 units.
If the next order is for 5 units, the warehouse is empty. Two units are missing for up to 60 working days, roughly three months. If you cushion this by setting safety stock to the largest past order, the reorder point becomes 8 units. That is €10,000 of stock for a part needed three times a year.
Both values are wrong, just in opposite directions: one costs availability, the other ties up capital. The formula only knows an average for demand, and that average hides when and in what quantities the part is actually needed.
Current research confirms this. In a review published in Omega (2021), Pinçe, Turrini and Meissner analyse the research on spare parts forecasting quantitatively. Their conclusion: which method works best depends on the part's demand pattern. There is no single method for all parts. A case study by Nabil, Afia and Ismail (Ain Shams Engineering Journal, 2026) on thrust bearings in centrifugal pumps also shows that a forecast-based inventory policy reduced both purchasing and holding costs compared with a classic min-max policy, i.e. logic built on a fixed reorder point.
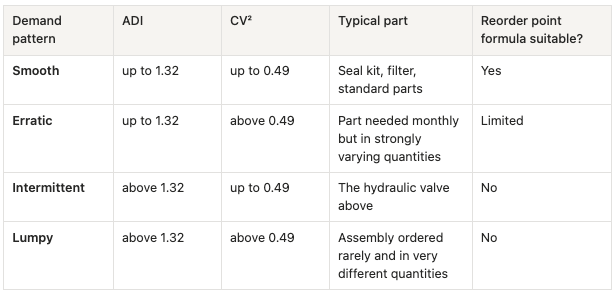
To classify parts by demand pattern, a grid of two measures has become standard, described in detail by Boylan and Syntetos in their reference work Intermittent Demand Forecasting (Wiley, 2021): the average inter-demand interval (ADI) and the variability of demand sizes (squared coefficient of variation, CV²).
Demand pattern
Rule of thumb for monthly data: an ADI above 1.32 means the part had demand in 9 or fewer of 12 months. The hydraulic valve had demand in 3 of 12 months (ADI = 4) with similar order sizes (CV² ≈ 0.04), which makes it clearly intermittent.
- Safety stock assumes a distribution that isn't there
Common safety stock formulas use the standard deviation of demand and assume demand varies normally around a mean. With many months of zero demand and a few large orders, that doesn't hold. The result is a safety stock that rarely fits the part, and with it, a wrong reorder point.
- The lead time in the master data is outdated or missing
Lead time is often maintained once and never touched again, while delivery times and suppliers change. For new parts it is frequently missing altogether. If the master record says zero, the reorder point equals the safety stock, and the system plans as if goods arrived the same day.
- The reorder point stays put, the installed base doesn't
A reorder point reflects the assumptions of the day it was set. Since then, machines may have been decommissioned, new machine types shipped, or parts replaced by successors. One simple question shows how current a value is: when was this reorder point last changed, and what assumption is it based on?
- Blanket rules for thousands of parts
Because nobody can maintain thousands of reorder points individually, many companies use blanket rules such as "three months of coverage for all A parts". That is pragmatic, but it treats a part with steady demand the same as one needed twice a year.
What works instead
In practice: Weinig
Weinig AG is a world-leading manufacturer of machinery and systems for solid wood and wood-based panel processing. In spare parts planning, its business units used different planning methods, and shortages and overstock occurred at the same time. Weinig replaced blanket safety stocks with SKU-specific demand forecasting. Together with PartsCloud, procurement parameters, minimum stock levels and supplier strategies were recalibrated based on per-part forecasts instead of experience values or flat surcharges. Rollout happened step by step, business unit by business unit, alongside ongoing ERP projects.
Where PartsOS Forecast fits in
PartsOS Forecast does not calculate reorder points and does not replace your MRP. It adds to your ERP the piece where the formula breaks down for spare parts: the demand forecast per part.
- For each part, several forecasting methods compete. The method that performed best in a backtest on that part's own history wins.
- Every forecast is valued in euros: the PC-Index shows how far the chosen method was from a perfect forecast in the backtest.
- Planners only review the forecasts where their judgement changes something, and release them.
- Released forecasts go to your ERP as gross demand, e.g. as planned independent requirements in SAP. Netting against stock, safety stock and lot sizing stay in your system.
- New parts without a lead time are planned with 42 days instead of zero and flagged until a real lead time is available.
Frequently asked questions
-
How do you calculate a reorder point?
Reorder point = average daily usage × replenishment lead time in days + safety stock. With 4 units of daily usage, a 15-day lead time and 20 units of safety stock, the reorder point is 80 units.
-
What is the difference between reorder point and safety stock?
The reorder point is the stock level at which you reorder. Safety stock is part of it: the buffer that normally stays untouched and only absorbs demand spikes or delivery delays.
-
What does replenishment lead time include?
It includes internal order processing, the supplier's delivery time, and goods receipt and inspection until the part is available in stock. Using only the supplier's delivery time leads to a reorder point that is too low.
-
Why does the reorder point often fail for spare parts?
Many spare parts are needed rarely and irregularly. The formula, however, uses an average daily usage that never actually occurs with sporadic demand. The reorder point is then either too low, causing shortages, or too high, tying up capital.
-
How often should reorder points be reviewed?
At the latest whenever lead time, supplier or installed base change, and regularly for critical parts, for example once a quarter. For intermittent parts, a regularly recalculated demand forecast is more reliable than a fixed value.
-
What is the reorder point in SAP?
In SAP the reorder point is a field in the material master (MRP 1 view). With MRP type VB it is maintained manually; with VM, SAP calculates it from the forecast. When stock falls below the reorder point, MRP creates a procurement proposal.
-
Sources
- Boylan, J. E. & Syntetos, A. A. (2021): Intermittent Demand Forecasting: Context, Methods and Applications. Wiley. ISBN 978-1-119-97608-0.
- Pinçe, Ç., Turrini, L. & Meissner, J. (2021): Intermittent demand forecasting for spare parts: A critical review. Omega, 105, 102513. doi.org/10.1016/j.omega.2021.102513
- Giannopoulos, P. G., Dasaklis, T. K., Tsantilis, I. & Patsakis, C. (2025): Machine learning algorithms in intermittent demand forecasting: a review. International Journal of Production Research. doi.org/10.1080/00207543.2025.2578701
- Nabil, O. M., Afia, N. & Ismail, T. (2026): Intermittent demand forecasting for spare parts using classification/regression models of machine learning and deep learning. Ain Shams Engineering Journal, 104445. doi.org/10.1016/j.asej.2026.104445